Race condition testing just became a scheduling problem.
Your test suite still cannot catch them, yet.
Why race condition testing stalls
Many security bugs are race conditions, and two threads have to land on the wrong interleaving before anything visibly breaks.
That makes three jobs hard: confirming a bug candidate spotted through code reading or static analysis, writing a regression test once the fix lands, and getting a fuzzer into code paths that only run while operations race.
On 8 September 2026, Jann Horn published tooling on the Project Zero blog that traces memory accesses across threads and then forces the order in which those accesses happen.
The compiler half has already shipped in LLVM 23.1.0. The kernel patches are not upstream, having been posted for review the same day, so trying this now means building a branch, which is a shorter step for anyone with Linux administration behind them.
Before this, the practical options were ugly. One was rebuilding the kernel with conditional delay calls sprinkled at the right points and keyed to the name of the running thread, and the other was stalling a thread with a DTrace probe, which only fires at function boundaries and explicit trace points.
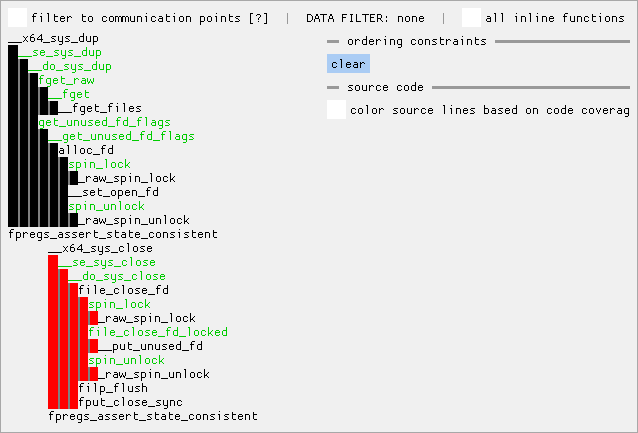
A race condition stops being a bug you hope to catch and becomes a bug you can schedule, once every memory access is recorded and the order of those accesses can be imposed from userspace.
How the tooling finds the candidates
Communication points
The idea comes from an older research system called SKI. Trace the memory accesses of every thread in a test case, then look for pairs of accesses on different threads where at least one is a write and the ranges overlap.
Those pairs are communication points, and they mark the places where two threads can decide the outcome of a run.
MAccConc collects them through ASAN instrumentation in outline mode, which emits a helper call at each memory access, and moves the trace to userspace over KCOV. Horn chose KCOV over ftrace for its simpler in memory trace format and because it is built for high frequency events.
Kernel fixes for race conditions usually arrive with handwritten ASCII diagrams of the offending interleaving. Horn's stated motivation includes tooling that can show a suspect interleaving in that same shape without waiting for a human to draw it after the fact.
Stable names for memory accesses
Naming an access by its data address does not survive a second run, because objects land at different addresses each time, and naming the instruction alone collapses inside a function like memcpy or a spin lock.
MAccConc labels each access with a stack trace annotated by call counts, so the second call to a function and the first call inside it name the same point across runs. Making that work required a change to SanitizerCoverage, which is the piece already in LLVM 23.1.0.
Forcing the ordering
A new ioctl, KCOV_SET_DI, lets userspace set or wait on a flag immediately before or after an access identified by one of those stack traces.
Two styles are supported: constraints of the form A happens before B, and a fully specified order that behaves like an explicit context switch between threads. The automatic tester walks the candidate interleavings on its own, the GUI and terminal tools let you impose an order on two accesses you pick out of a call graph, and the command line tester currently stops at two threads.
The published demos race a dup call against a close call on the same file descriptor, and the automatic tester walks its candidate orderings into runs where dup hands back a number that the other thread has just released. The same test case can be pushed the other way under the GUI, where an ordering constraint produces the opposite result on demand.
What to do differently
- Record accesses instead of widening windows. Before you add sleeps or hammer a failing test in a loop, instrument the build so each access is visible and let the candidate pairs fall out of a single run.
- Force the ordering you suspect. A constraint between two named accesses turns a bug that was probably there into one that is either proven or disproven, and the result repeats on every run rather than once in fifty.
- Commit the forced ordering with the fix. A scheduled interleaving is a test artefact rather than a lucky afternoon, so it belongs in your CI/CD pipelines next to the tests that already run on every push.
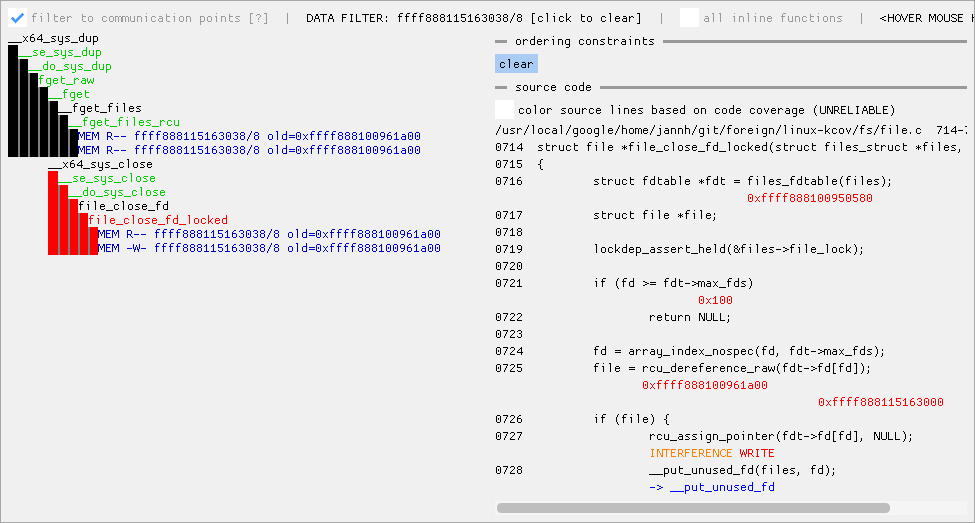
Screenshots: Jann Horn, Project Zero.
Where the instrumentation is blind
ASAN emits no helper call for direct stack accesses unless an out of bounds access is possible, so races involving on stack objects such as wait queues can slip past. Global variables are skipped by default as well and need the asan-opt-globals flag switched off.
Background work is only partly covered, because RCU callbacks and similar execution contexts are not wired into KCOV remote coverage yet, though a draft patch exists for the first of them. A clean run is therefore weaker evidence than a failed one.
The same instrumentation is meant to drive fuzzing later, but the userspace half of that work is still unwritten.
What this changes
The old assumption was that a race is a flaky test you quarantine and a suspect bug you fix without proof.
The new reality is that a race is a schedule you can write down, replay on demand, and hand to the next engineer alongside the patch.
What is the race in your codebase that everyone has quietly agreed will never reproduce?